Drawing Functions
Drawing functions work with matrices/images of arbitrary depth. The boundaries of the shapes can be rendered with antialiasing (implemented only for 8-bit images for now). All the functions include the parameter color that uses a rgb value (that may be constructed with CV_RGB or the Scalar constructor ) for color images and brightness for grayscale images. For color images the order channel is normally Blue, Green, Red , this is what imshow() , imread() and imwrite() expect , so if you form a color using Scalar constructor, it should look like:
![\texttt{Scalar} (blue \_ component, green \_ component, red \_ component[, alpha \_ component])](_images/math/5171941f9fb93474dcbf869f31eb9bf352d2ed00.png)
If you are using your own image rendering and I/O functions, you can use any channel ordering, the drawing functions process each channel independently and do not depend on the channel order or even on the color space used. The whole image can be converted from BGR to RGB or to a different color space using cvtColor() .
If a drawn figure is partially or completely outside the image, the drawing functions clip it. Also, many drawing functions can handle pixel coordinates specified with sub-pixel accuracy, that is, the coordinates can be passed as fixed-point numbers, encoded as integers. The number of fractional bits is specified by the
shift
parameter and the real point coordinates are calculated as
 . This feature is especially effective wehn rendering antialiased shapes.
Also, note that the functions do not support alpha-transparency - when the target image is 4-channnel, then the color[3] is simply copied to the repainted pixels. Thus, if you want to paint semi-transparent shapes, you can paint them in a separate buffer and then blend it with the main image.
cv::circle
- void circle(Mat& img, Point center, int radius, const Scalar& color, int thickness=1, int lineType=8, int shift=0)
Draws a circle
Parameters: - img – Image where the circle is drawn
- center – Center of the circle
- radius – Radius of the circle
- color – Circle color
- thickness – Thickness of the circle outline if positive; negative thickness means that a filled circle is to be drawn
- lineType – Type of the circle boundary, see line() description
- shift – Number of fractional bits in the center coordinates and radius value
The function circle draws a simple or filled circle with a given center and radius.
cv::clipLine
- bool clipLine(Size imgSize, Point& pt1, Point& pt2)
- bool clipLine(Rect imgRect, Point& pt1, Point& pt2)
Clips the line against the image rectangle
Parameters: - imgSize – The image size; the image rectangle will be Rect(0, 0, imgSize.width, imgSize.height)
- imgSize – The image rectangle
- pt1 – The first line point
- pt2 – The second line point
The functions clipLine calculate a part of the line segment which is entirely within the specified rectangle. They return false if the line segment is completely outside the rectangle and true otherwise.
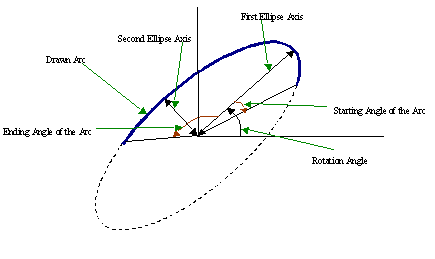
cv::ellipse
- void ellipse(Mat& img, Point center, Size axes, double angle, double startAngle, double endAngle, const Scalar& color, int thickness=1, int lineType=8, int shift=0)
- void ellipse(Mat& img, const RotatedRect& box, const Scalar& color, int thickness=1, int lineType=8)
Draws a simple or thick elliptic arc or an fills ellipse sector.
Parameters: - img – The image
- center – Center of the ellipse
- axes – Length of the ellipse axes
- angle – The ellipse rotation angle in degrees
- startAngle – Starting angle of the elliptic arc in degrees
- endAngle – Ending angle of the elliptic arc in degrees
- box – Alternative ellipse representation via a RotatedRect , i.e. the function draws an ellipse inscribed in the rotated rectangle
- color – Ellipse color
- thickness – Thickness of the ellipse arc outline if positive, otherwise this indicates that a filled ellipse sector is to be drawn
- lineType – Type of the ellipse boundary, see line() description
- shift – Number of fractional bits in the center coordinates and axes’ values
The functions ellipse with less parameters draw an ellipse outline, a filled ellipse, an elliptic arc or a filled ellipse sector. A piecewise-linear curve is used to approximate the elliptic arc boundary. If you need more control of the ellipse rendering, you can retrieve the curve using ellipse2Poly() and then render it with polylines() or fill it with fillPoly() . If you use the first variant of the function and want to draw the whole ellipse, not an arc, pass startAngle=0 and endAngle=360 . The picture below explains the meaning of the parameters.
Parameters of Elliptic Arc
cv::ellipse2Poly
- void ellipse2Poly(Point center, Size axes, int angle, int startAngle, int endAngle, int delta, vector<Point>& pts)
Approximates an elliptic arc with a polyline
Parameters: - center – Center of the arc
- axes – Half-sizes of the arc. See ellipse()
- angle – Rotation angle of the ellipse in degrees. See ellipse()
- startAngle – Starting angle of the elliptic arc in degrees
- endAngle – Ending angle of the elliptic arc in degrees
- delta – Angle between the subsequent polyline vertices. It defines the approximation accuracy.
- pts – The output vector of polyline vertices
The function ellipse2Poly computes the vertices of a polyline that approximates the specified elliptic arc. It is used by ellipse() .
cv::fillConvexPoly
- void fillConvexPoly(Mat& img, const Point* pts, int npts, const Scalar& color, int lineType=8, int shift=0)
Fills a convex polygon.
Parameters: - img – Image
- pts – The polygon vertices
- npts – The number of polygon vertices
- color – Polygon color
- lineType – Type of the polygon boundaries, see line() description
- shift – The number of fractional bits in the vertex coordinates
The function fillConvexPoly draws a filled convex polygon. This function is much faster than the function fillPoly and can fill not only convex polygons but any monotonic polygon without self-intersections, i.e., a polygon whose contour intersects every horizontal line (scan line) twice at the most (though, its top-most and/or the bottom edge could be horizontal).
cv::fillPoly
- void fillPoly(Mat& img, const Point** pts, const int* npts, int ncontours, const Scalar& color, int lineType=8, int shift=0, Point offset=Point())
Fills the area bounded by one or more polygons
Parameters: - img – Image
- pts – Array of polygons, each represented as an array of points
- npts – The array of polygon vertex counters
- ncontours – The number of contours that bind the filled region
- color – Polygon color
- lineType – Type of the polygon boundaries, see line() description
- shift – The number of fractional bits in the vertex coordinates
The function fillPoly fills an area bounded by several polygonal contours. The function can fills complex areas, for example, areas with holes, contours with self-intersections (some of thier parts), and so forth.
cv::getTextSize
- Size getTextSize(const string& text, int fontFace, double fontScale, int thickness, int* baseLine)
Calculates the width and height of a text string.
Parameters: - text – The input text string
- fontFace – The font to use; see putText()
- fontScale – The font scale; see putText()
- thickness – The thickness of lines used to render the text; see putText()
- baseLine – The output parameter - y-coordinate of the baseline relative to the bottom-most text point
The function getTextSize calculates and returns size of the box that contain the specified text. That is, the following code will render some text, the tight box surrounding it and the baseline:
// Use "y" to show that the baseLine is about
string text = "Funny text inside the box";
int fontFace = FONT_HERSHEY_SCRIPT_SIMPLEX;
double fontScale = 2;
int thickness = 3;

Mat img(600, 800, CV_8UC3, Scalar::all(0));

int baseline=0;
Size textSize = getTextSize(text, fontFace,
                            fontScale, thickness, &baseline);
baseline += thickness;

// center the text
Point textOrg((img.cols - textSize.width)/2,
              (img.rows + textSize.height)/2);

// draw the box
rectangle(img, textOrg + Point(0, baseline),
          textOrg + Point(textSize.width, -textSize.height),
          Scalar(0,0,255));
// ... and the baseline first
line(img, textOrg + Point(0, thickness),
     textOrg + Point(textSize.width, thickness),
     Scalar(0, 0, 255));

// then put the text itself
putText(img, text, textOrg, fontFace, fontScale,
        Scalar::all(255), thickness, 8);
cv::line
- void line(Mat& img, Point pt1, Point pt2, const Scalar& color, int thickness=1, int lineType=8, int shift=0)
Draws a line segment connecting two points
Parameters: - img – The image
- pt1 – First point of the line segment
- pt2 – Second point of the line segment
- color – Line color
- thickness – Line thickness
- lineType –
Type of the line:
- 8 (or omitted) 8-connected line.
- 4 4-connected line.
- CV_AA antialiased line.
- shift – Number of fractional bits in the point coordinates
The function line draws the line segment between pt1 and pt2 points in the image. The line is clipped by the image boundaries. For non-antialiased lines with integer coordinates the 8-connected or 4-connected Bresenham algorithm is used. Thick lines are drawn with rounding endings. Antialiased lines are drawn using Gaussian filtering. To specify the line color, the user may use the macro CV_RGB(r, g, b) .
LineIterator
- LineIterator
Class for iterating pixels on a raster line
class LineIterator
{
public:
    // creates iterators for the line connecting pt1 and pt2
    // the line will be clipped on the image boundaries
    // the line is 8-connected or 4-connected
    // If leftToRight=true, then the iteration is always done
    // from the left-most point to the right most,
    // not to depend on the ordering of pt1 and pt2 parameters
    LineIterator(const Mat& img, Point pt1, Point pt2,
                 int connectivity=8, bool leftToRight=false);
    // returns pointer to the current line pixel
    uchar* operator *();
    // move the iterator to the next pixel
    LineIterator& operator ++();
    LineIterator operator ++(int);

    // internal state of the iterator
    uchar* ptr;
    int err, count;
    int minusDelta, plusDelta;
    int minusStep, plusStep;
};
The class LineIterator is used to get each pixel of a raster line. It can be treated as versatile implementation of the Bresenham algorithm, where you can stop at each pixel and do some extra processing, for example, grab pixel values along the line, or draw a line with some effect (e.g. with XOR operation).
The number of pixels along the line is store in LineIterator::count .
// grabs pixels along the line (pt1, pt2)
// from 8-bit 3-channel image to the buffer
LineIterator it(img, pt1, pt2, 8);
vector<Vec3b> buf(it.count);

for(int i = 0; i < it.count; i++, ++it)
    buf[i] = *(const Vec3b)*it;
cv::rectangle
- void rectangle(Mat& img, Point pt1, Point pt2, const Scalar& color, int thickness=1, int lineType=8, int shift=0)
Draws a simple, thick, or filled up-right rectangle.
Parameters: - img – Image
- pt1 – One of the rectangle’s vertices
- pt2 – Opposite to pt1 rectangle vertex
- color – Rectangle color or brightness (grayscale image)
- thickness – Thickness of lines that make up the rectangle. Negative values, e.g. CV_FILLED , mean that the function has to draw a filled rectangle.
- lineType – Type of the line, see line() description
- shift – Number of fractional bits in the point coordinates
The function rectangle draws a rectangle outline or a filled rectangle, which two opposite corners are pt1 and pt2 .
cv::polylines
- void polylines(Mat& img, const Point** pts, const int* npts, int ncontours, bool isClosed, const Scalar& color, int thickness=1, int lineType=8, int shift=0)
Draws several polygonal curves
Parameters: - img – The image
- pts – Array of polygonal curves
- npts – Array of polygon vertex counters
- ncontours – The number of curves
- isClosed – Indicates whether the drawn polylines are closed or not. If they are closed, the function draws the line from the last vertex of each curve to its first vertex
- color – Polyline color
- thickness – Thickness of the polyline edges
- lineType – Type of the line segments, see line() description
- shift – The number of fractional bits in the vertex coordinates
The function polylines draws one or more polygonal curves.
cv::putText
- void putText(Mat& img, const string& text, Point org, int fontFace, double fontScale, Scalar color, int thickness=1, int lineType=8, bool bottomLeftOrigin=false)
Draws a text string
Parameters: - img – The image
- text – The text string to be drawn
- org – The bottom-left corner of the text string in the image
- fontFace –
The font type, one of FONT_HERSHEY_SIMPLEX , FONT_HERSHEY_PLAIN , FONT_HERSHEY_DUPLEX , FONT_HERSHEY_COMPLEX , FONT_HERSHEY_TRIPLEX , FONT_HERSHEY_COMPLEX_SMALL , FONT_HERSHEY_SCRIPT_SIMPLEX or FONT_HERSHEY_SCRIPT_COMPLEX ,
where each of the font id’s can be combined with FONT_HERSHEY_ITALIC to get the slanted letters.
- fontScale – The font scale factor that is multiplied by the font-specific base size
- color – The text color
- thickness – Thickness of the lines used to draw the text
- lineType – The line type; see line for details
- bottomLeftOrigin – When true, the image data origin is at the bottom-left corner, otherwise it’s at the top-left corner
The function putText renders the specified text string in the image. Symbols that can not be rendered using the specified font are replaced by question marks. See getTextSize() for a text rendering code example.
Help and Feedback
You did not find what you were looking for?- Try the Cheatsheet.
- Ask a question in the user group/mailing list.
- If you think something is missing or wrong in the documentation, please file a bug report.