画像のカラーヒストグラムの描画
C
#include <cv.h>
#include <highgui.h>

int
main (int argc, char **argv)
{
  int i, j, bin_w;
  int hist_size = 256;
  int sch = 0, ch_width = 260;
  float max_val = 0;
  float range_0[] = { 0, 256 };
  float *ranges[] = { range_0 };
  IplImage *src_img = 0, *planes[4] = { 0, 0, 0, 0 }, *hist_img;
  CvHistogram *hist[3];
  char *imagename;
  CvScalar color = cvScalarAll(100);

  // (1)load a source image as is
  //    and allocate the same number of images and histogram structures as the channels
  imagename = argc > 1 ? argv[1] : "../image/flower_color.png";
  src_img = cvLoadImage(imagename, CV_LOAD_IMAGE_ANYCOLOR);
  if(src_img == 0)
    return -1;
  sch = src_img->nChannels;
  for (i = 0; i < sch; i++) {
    planes[i] = cvCreateImage(cvSize(src_img->width, src_img->height), src_img->depth, 1);
    hist[i] = cvCreateHist(1, &hist_size, CV_HIST_ARRAY, ranges, 1);
  }

  // (2)allocate IplImage to draw a histogram image
  hist_img = cvCreateImage(cvSize(ch_width * sch, 200), 8, 3);
  cvSet(hist_img, cvScalarAll (255), 0);

  if (sch == 1) {
    // (3a)if the source image has single-channel, calculate its histogram
    cvCopy(src_img, planes[0], NULL);
    cvCalcHist(&planes[0], hist[0], 0, NULL);
    cvGetMinMaxHistValue (hist[0], 0, &max_val, 0, 0);
  } else {
    // (3b)if the souce image has multi-channel, aplit it and calculate histogram of each plane
    cvSplit(src_img, planes[0], planes[1], planes[2], planes[3]);
    for (i = 0; i < sch; i++) {
      float tmp_val;
      cvCalcHist (&planes[i], hist[i], 0, NULL);
      cvGetMinMaxHistValue (hist[i], 0, &tmp_val, 0, 0);
      max_val = max_val < tmp_val ? tmp_val : max_val;
    }
  }

   // (4)scale and draw the histogram(s)
  for (i = 0; i < sch; i++) {
    if(sch==3)
      color = cvScalar((0xaa<<i*8)&0x0000ff,(0xaa<<i*8)&0x00ff00,(0xaa<<i*8)&0xff0000, 0);
    cvScale (hist[i]->bins, hist[i]->bins, ((double) hist_img->height) / max_val, 0);
    bin_w = cvRound ((double) ch_width / hist_size);
    for (j = 0; j < hist_size; j++)
      cvRectangle (hist_img,
		   cvPoint(j*bin_w+(i*ch_width), hist_img->height),
		   cvPoint((j+1)*bin_w+(i*ch_width), hist_img->height-cvRound(cvGetReal1D(hist[i]->bins, j))),
		   color, -1, 8, 0);
  }

  // (5)show the histogram iamge, and quit when any key pressed
  cvNamedWindow ("Image", CV_WINDOW_AUTOSIZE);
  cvShowImage ("Image", src_img);
  cvNamedWindow ("Histogram", CV_WINDOW_AUTOSIZE);
  cvShowImage ("Histogram", hist_img);
  cvWaitKey (0);

  cvDestroyWindow("Histogram");
  cvReleaseImage(&src_img);
  cvReleaseImage(&hist_img);
  for(i=0; i<sch; i++) {
    cvReleaseImage(&planes[i]);
    cvReleaseHist(&hist[i]);
  }

  return 0;
}
// (1)画像を読み込みます.また,チャンネル数と同数の画像領域,ヒストグラム構造体を確保します.
指定された画像を,そのままに(色の変換をせずに)読み込みます.つまり,カラー画像はカラー画像として,グレースケール画像はグレースケール画像として読み込まれます.
また,入力画像のチャンネル数に応じて,必要となる画像領域(cvCreateImage),ヒストグラム構造体(cvCreateHist)を確保します.
// (2)ヒストグラムを描画する画像領域を確保します.
入力画像のチャンネル数に応じて,ヒストグラムを描画するための画像領域を確保します.cvSet を利用して,その画像を白で塗りつぶして初期化します.
// (3a)入力画像が1チャンネル画像ならば,そのチャンネルのヒストグラムを求めます.
cvCalcHist により,ヒストグラムを求めます.また,後でヒストグラムの正規化に利用するので, cvGetMinMaxHistValue を用いてヒストグラムの最大値を求めておきます.
// (3b)入力画像が多チャンネル画像ならば,それぞれのヒストグラムを求めます.
まず, cvSplit を用いて,画像を各チャンネル毎に分解します.次に, cvCalcHist により,各チャンネル毎のヒストグラムを求めます.また,後でヒストグラムの正規化に利用するので, cvGetMinMaxHistValue を用いてヒストグラムの(全てのチャンネルでの)最大値を求めておきます.
// (4)ヒストグラムをスケーリングし,描画します.
あらかじめ求めておいた最大値を基準に,cvScale を用いてヒストグラムの正規化を行います.ここでの正規化は,ビンの合計値を基準にしたものではないことに注意してください.その後,各チャンネルのヒストグラムを,対応する色で描画します.なお,cvScale は以下のようにマクロ定義されています.
#define cvScale cvConvertScale
// (5)ヒストグラム画像を表示し,何かキーが押されると終了します.
入力画像,およびそのヒストグラム画像を表示します.何かキーが押されると,プログラムを終了します.
C++
#include <cv.h>
#include <highgui.h>
#include <iostream>

using namespace cv;

int
main (int argc, char **argv)
{

  // (1)load a source image as is
  const char *imagename = argc > 1 ? argv[1] : "../image/flower_color.png";
  Mat src_img = imread(imagename, -1);
  if(!src_img.data)
    return -1;

  // (2)allocate Mat to draw a histogram image
  const int ch_width = 260;
  const int sch = src_img.channels();
  Mat hist_img(Size(ch_width * sch, 200), CV_8UC3, Scalar::all(255));

  vector<MatND> hist(3);
  const int hist_size = 256;
  const int hdims[] = {hist_size};
  const float hranges[] = {0,256};
  const float* ranges[] = {hranges};
  double max_val = .0;

  if(sch==1) {
    // (3a)if the source image has single-channel, calculate its histogram
    calcHist(&src_img, 1, 0, Mat(), hist[0], 1, hdims, ranges, true, false);
    minMaxLoc(hist[0], 0, &max_val);
  } else {
    // (3b)if the souce image has multi-channel, calculate histogram of each plane
    for(int i=0; i<sch; ++i) {
      calcHist(&src_img, 1, &i, Mat(), hist[i], 1, hdims, ranges, true, false);
      double tmp_val;
      minMaxLoc(hist[i], 0, &tmp_val);
      max_val = max_val < tmp_val ? tmp_val : max_val;
    }
  }

  // (4)scale and draw the histogram(s)
  Scalar color = Scalar::all(100);
  for(int i=0; i<sch; i++) {
    if(sch==3)
      color = Scalar((0xaa<<i*8)&0x0000ff,(0xaa<<i*8)&0x00ff00,(0xaa<<i*8)&0xff0000, 0);
    hist[i].convertTo(hist[i], hist[i].type(), max_val?200./max_val:0.,0);
    for(int j=0; j<hist_size; ++j) {
      int bin_w = saturate_cast<int>((double)ch_width/hist_size);
      rectangle(hist_img,
		Point(j*bin_w+(i*ch_width), hist_img.rows),
		Point((j+1)*bin_w+(i*ch_width), hist_img.rows-saturate_cast<int>(hist[i].at<float>(j))),
		color, -1);
    }
  }

  // (5)show the histogram iamge, and quit when any key pressed
  namedWindow("Image", CV_WINDOW_AUTOSIZE);
  namedWindow("Histogram", CV_WINDOW_AUTOSIZE);
  imshow("Image", src_img);
  imshow("Histogram", hist_img);
  waitKey(0);

  return 0;
}
// (1)画像を読み込みます.
指定された画像を,そのままに(色の変換をせずに)読み込みます.つまり,カラー画像はカラー画像として,グレースケール画像はグレースケール画像として読み込まれます.
// (2)ヒストグラムを描画する画像領域を確保します.
入力画像のチャンネル数に応じて,ヒストグラムを描画するための画像領域を確保します.
// (3a)入力画像が1チャンネル画像ならば,そのチャンネルのヒストグラムを求めます.
calcHist により,ヒストグラムを求めます.また,後でヒストグラムの正規化に利用するので, minMaxLoc を用いてヒストグラムの最大値を求めておきます.
// (3b)入力画像が多チャンネル画像ならば,それぞれのヒストグラムを求めます.
calcHist により,各チャンネルのヒストグラムを求めます.また,後でヒストグラムの正規化に利用するので, minMaxLoc を用いて(全てのチャンネルでの)ヒストグラムの最大値を求めておきます.
// (4)ヒストグラムをスケーリングし,描画します.
あらかじめ求めておいた最大値を基準に,MatND.convertTo を用いてヒストグラムの正規化を行います.ここでの正規化は,ビンの合計値を基準にしたものではないことに注意してください.その後,各チャンネルのヒストグラムを,対応する色で描画します.
// (5)ヒストグラム画像を表示し,何かキーが押されると終了します.
入力画像,およびそのヒストグラム画像を表示します.何かキーが押されると,プログラムを終了します.
実行結果例
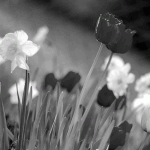
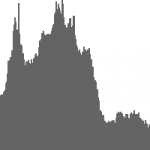
(左から)グレースケール画像,およびそのヒストグラム(1チャンネル)
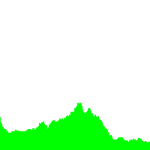
(左から)カラー画像,およびそのヒストグラム(3チャンネル)


